Docker Containers
Portainer
Web GUI to manage Docker containers being run on a Docker Engine hosted on an Ubuntu server
GUI Preview
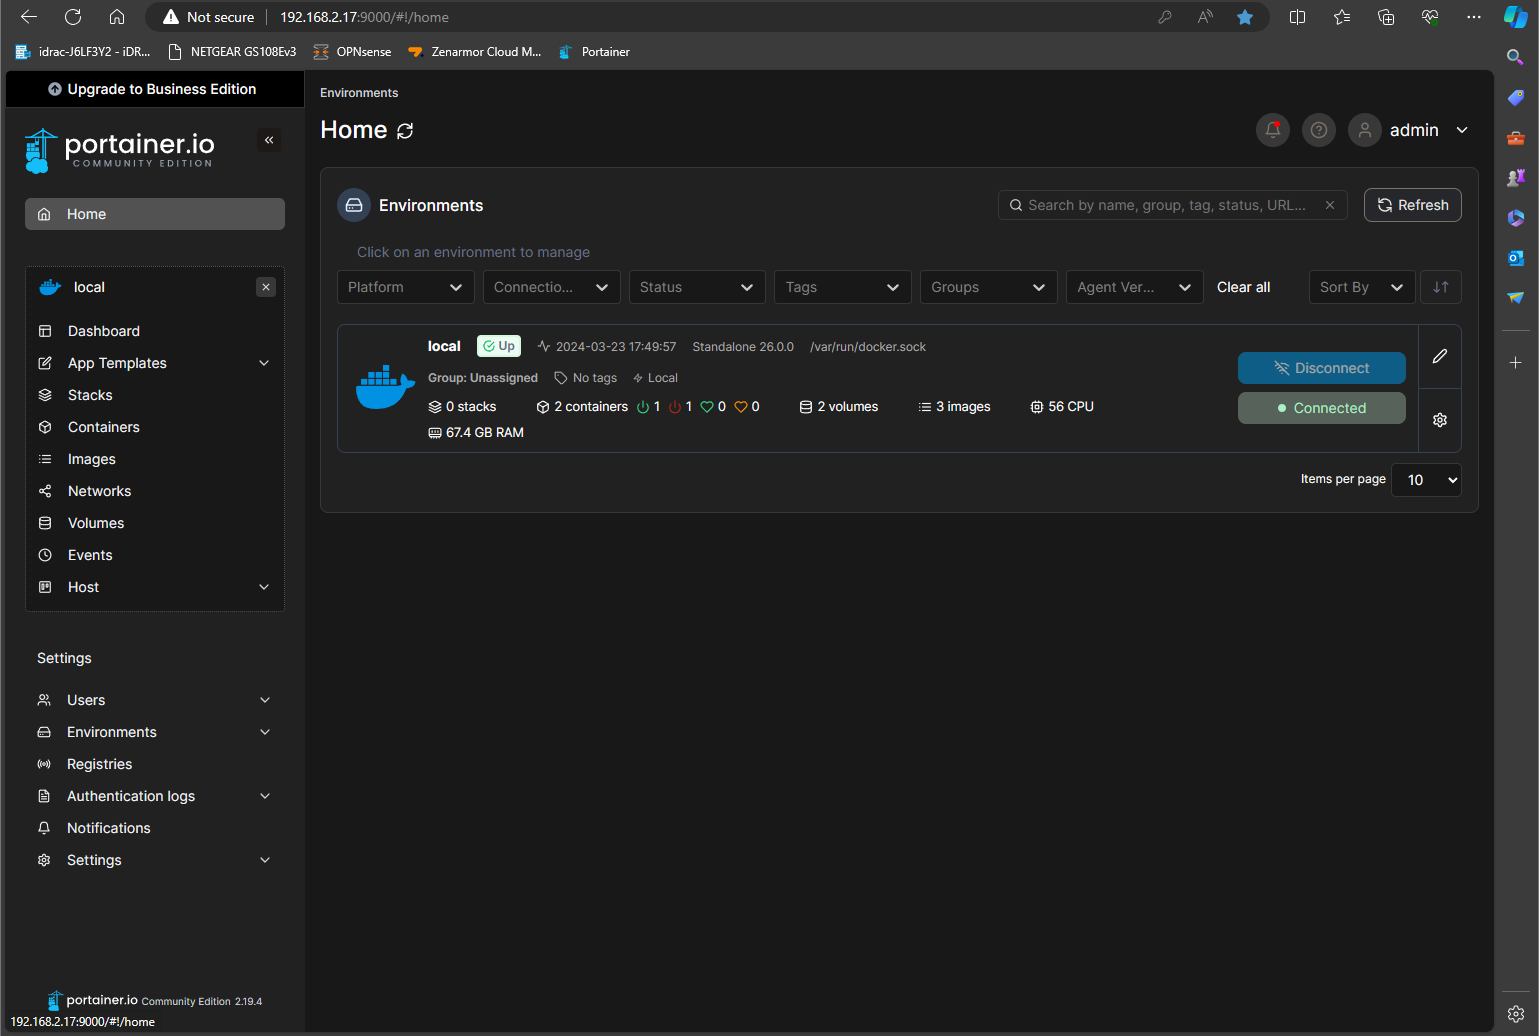
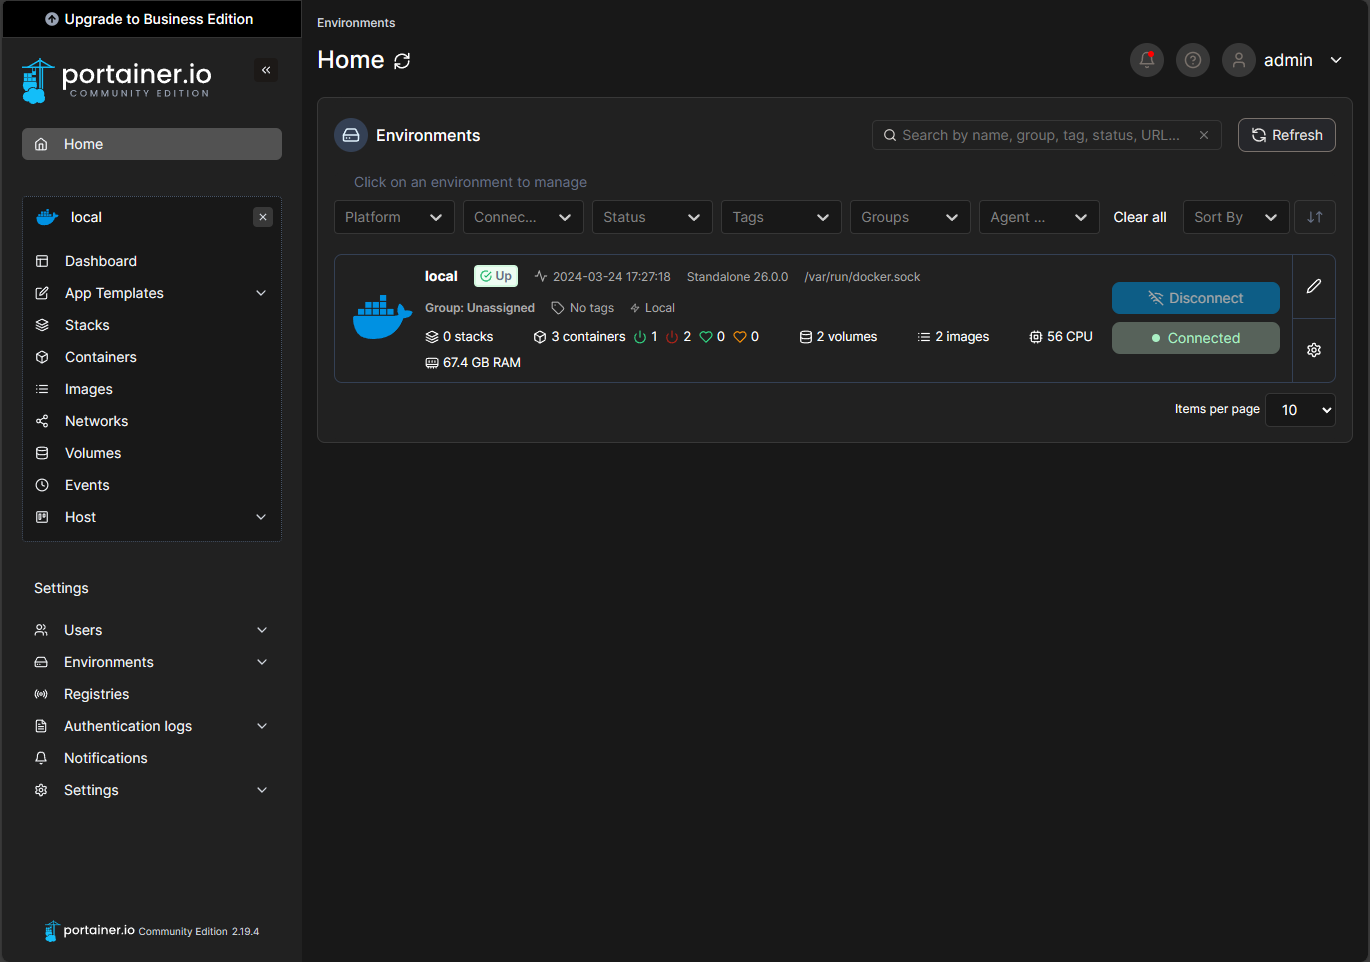
Once your docker container is successfully up and running, you can access your Portainer web GUI on port 9000 of your Ubuntu Server's static IP. The homepage above shows I have my docker environment currently running and connected, which means I can deploy containers and configure them however I'd like. Your next steps should be to connect your docker profile so that you can push images.
Deployment
To deploy the Portainer container, you'll need to first set up a couple of configurations. These configurations will create a persistent volume, expose ports, and enable the container to run at start up automatically.
Create Persistent Volume
In your docker engine CLI, run the following command:
-
docker volume create portainer_data
- Volume name is portainer_data
Run the Container
Run the container as you would any other container, with the following ports exposed: 8000 (Portainer Agent), 9000(Web GUI)
-
docker run -d -p 8000:8000 -p 9000:9000 --name=portainer --restart=always /var/run/docker.sock:/var/run/docker.sock -v portainer_data:/data portainer/portainer-ce
- -d to run in background
- -p to expose ports
- --name to name container
- --restart to make it run constantly
- /var/run/docker.sock:/var/run/docker.sock to enable portainer to manage the docker registry of the local machine
- -v declares a volume to use
- portainer/portainer-ce refers to the community edition version of the container
You're all set! Run through the set-up wizard via the web GUI that can be accessed at your docker engine IP port 9000 and create your admin account. You can now view the following dashboard:
InfluxDB
Database to store data from OPNsense and Proxmox. Will be used to populate Grafana Dashboards
GUI Preview
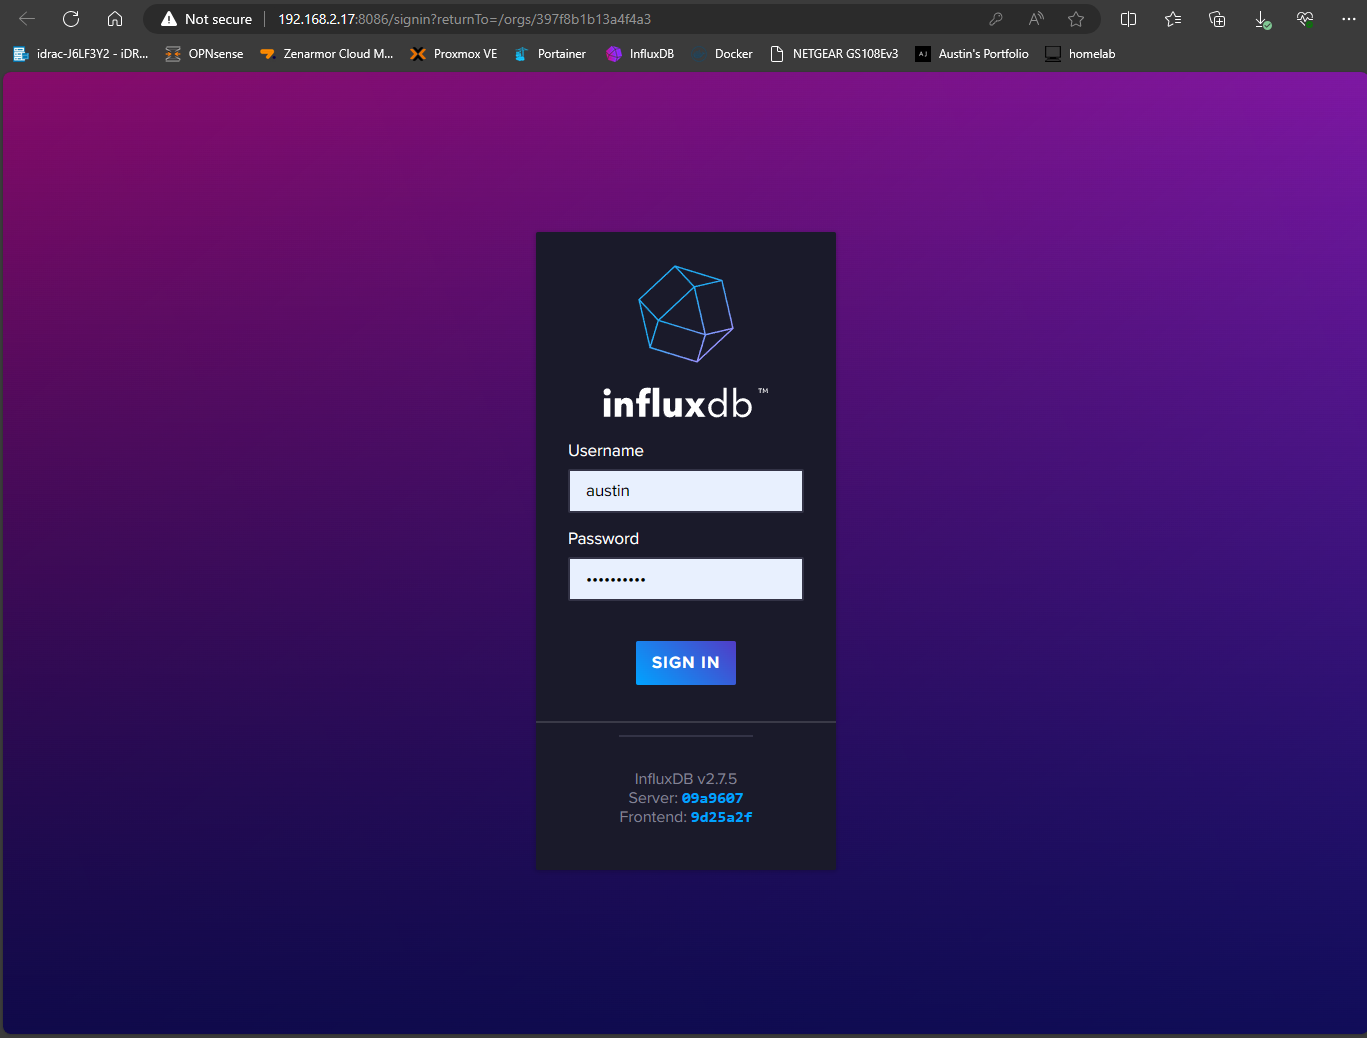
Once your docker container is configured and running, you should be able to access the Web GUI:
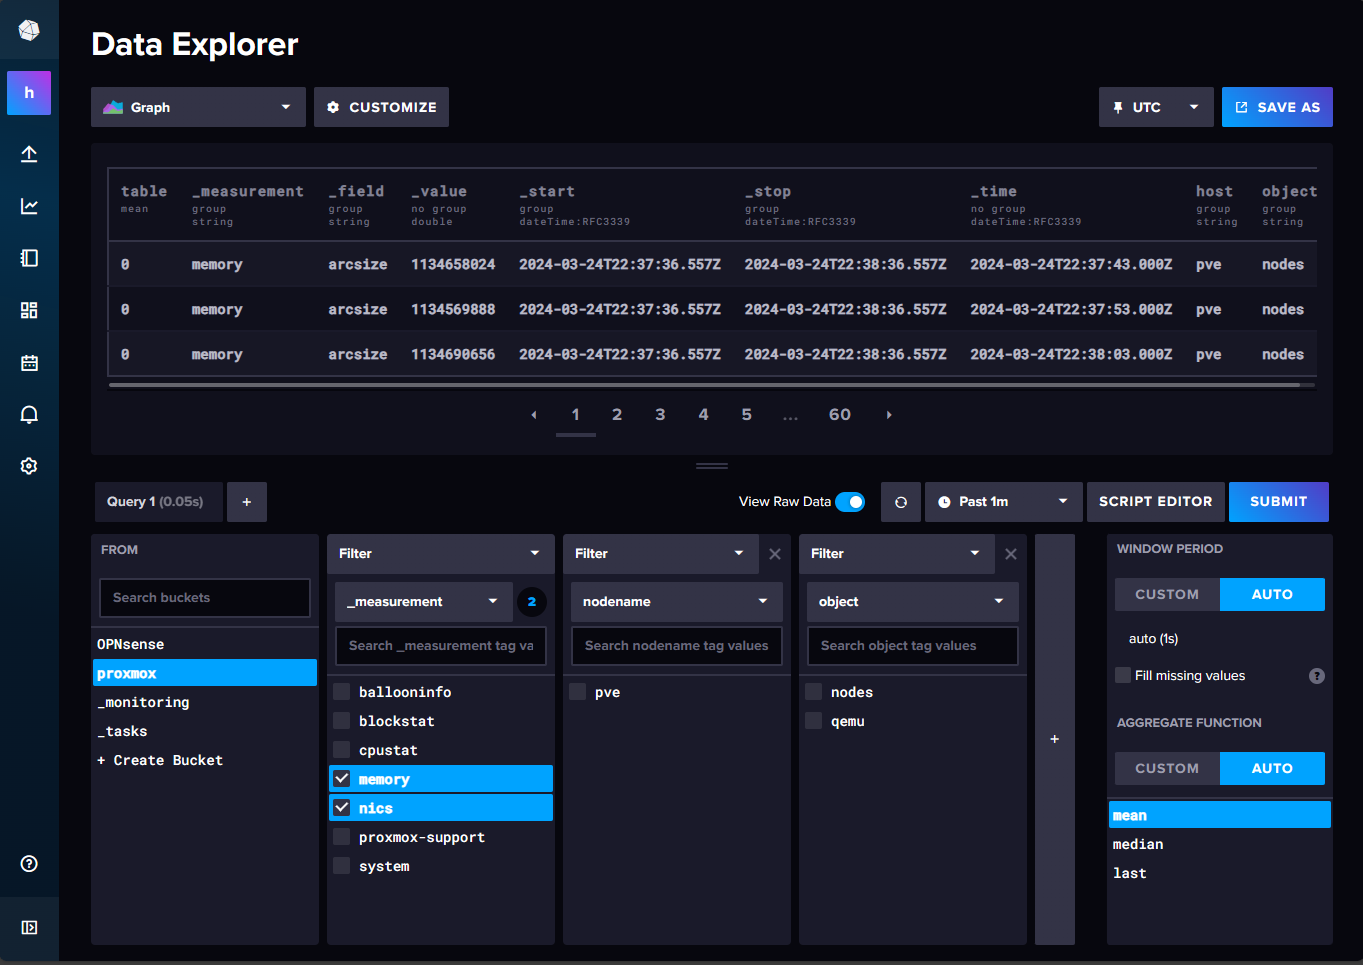
Create buckets to store and query data via the Data Explorer tab:

Once you create connections from buckets to your systems using the API tokens, select the bucket. You should be able to view the raw data being collected. After setting up my Proxmox bucket to receive data from my Proxmox VE to the influxDB, you can see it working below:
Grafana
Used to build dashboards!
GUI Preview
Download and run the Grafana container. You can get more details about how to do so @DockerHub - Grafana. Or, you can just run the following command:
-
docker run -d --name=grafana -p 3000:3000 grafana/grafana- 3000:3000 specifies it'll be accesible from port 3000 of the docker engine, which in my case is 192.168.2.17.
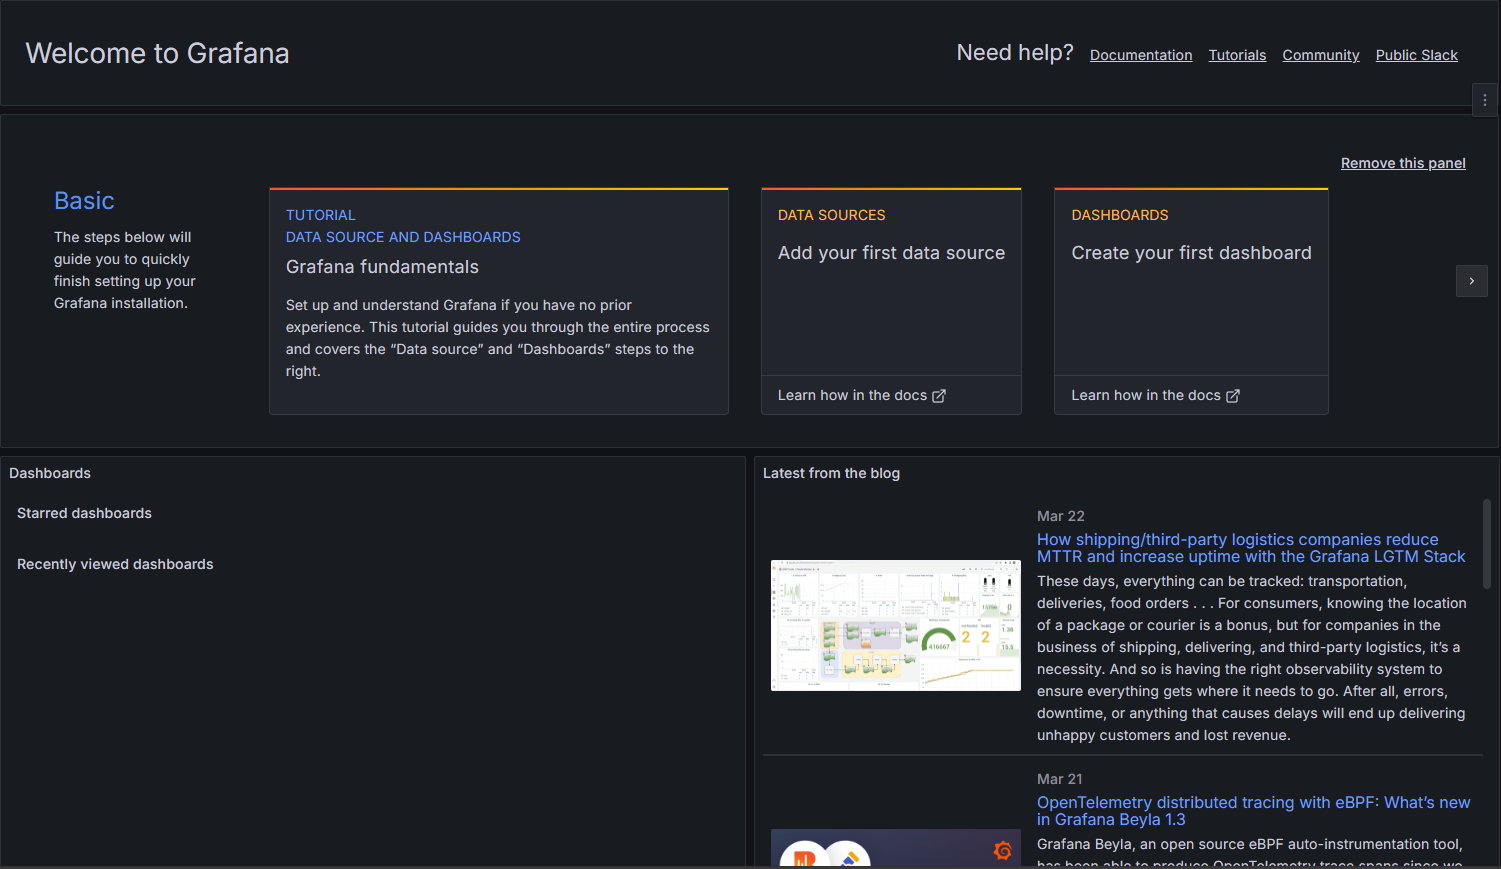
- Once the container is running, go through the initial set up wizard via the Web GUI:
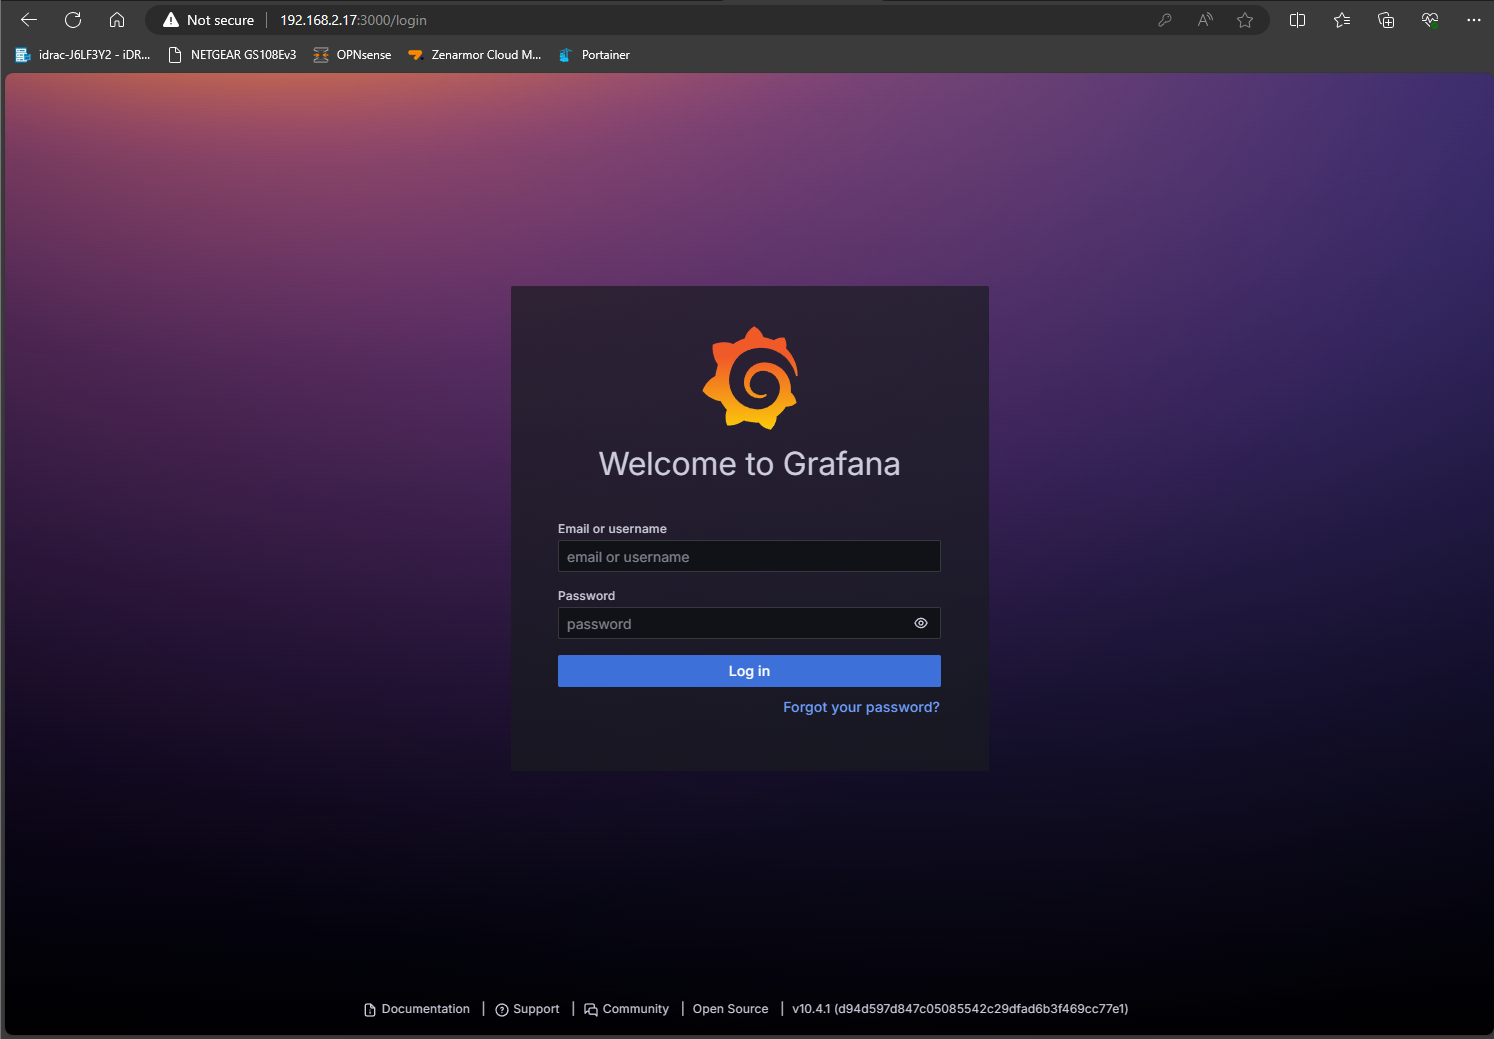
With your Grafana container running, it can be accessed via port 3000 of your localhost. The default login username and password is admin. Once logged in, you should see a home page like the one below: