Proxmox Dash: InfluxDB + Grafana
Dashboard for Proxmox using Proxmox bucket from InfluxDB & Proxmox [Flux] Dashboard from Grafana
InfluxDB
Database that writes and queries data to then be used to populate Grafana Dashboards
Check out the Docker shelf to see how to set up the InfluxDB container here
Proxmox Connection
With your InfluxDB container running, you can now configure Proxmox to send data to it via the IP address and Port Number you assigned it.
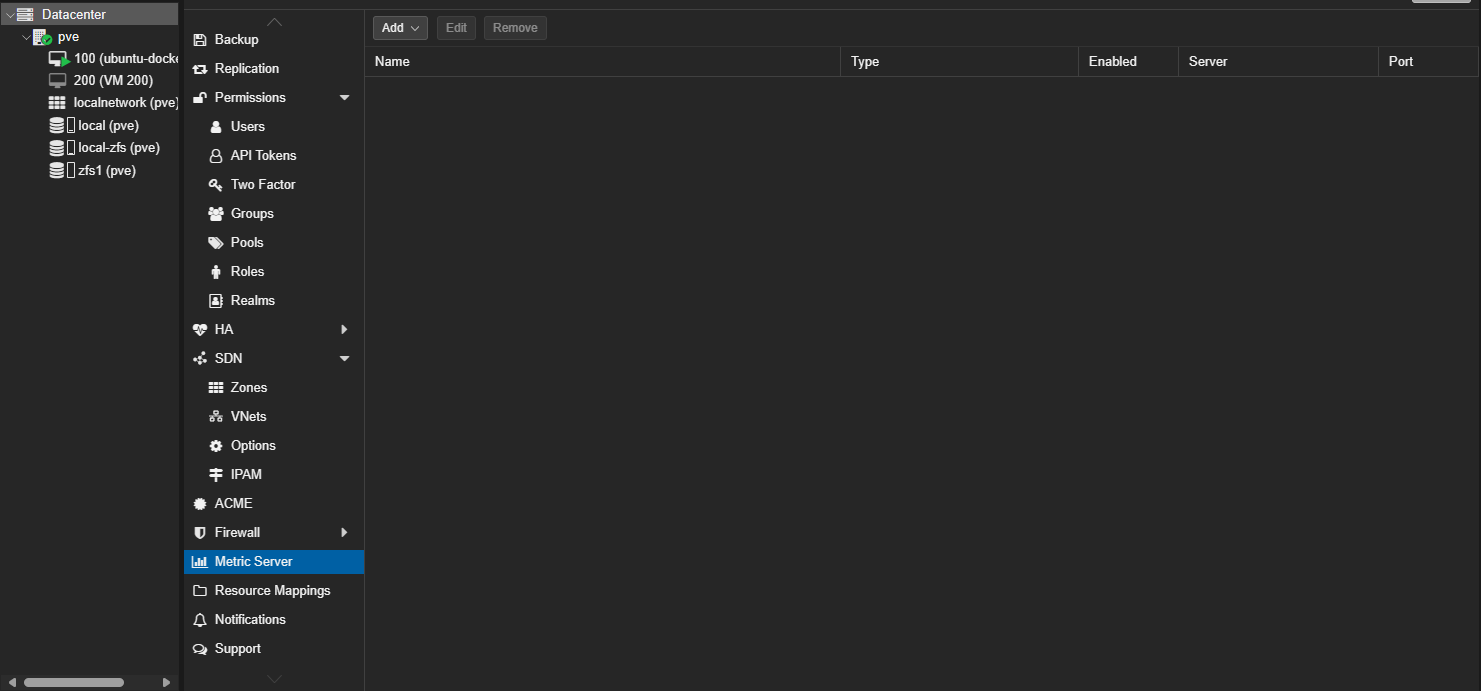
- Navigate to the following page: Datacenter ---> Metrics Server
-
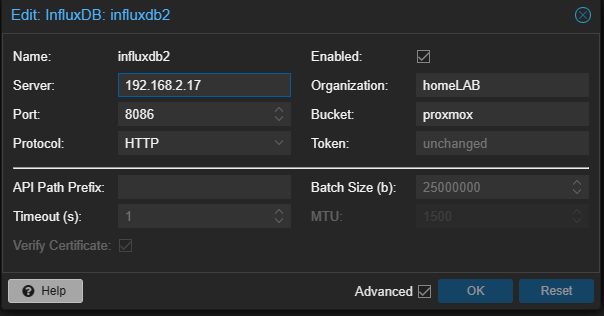
- Select Add and enter your InfluxDB information:
- Create an API Token via the InfluxDB GUI and save it to be entered here:
-

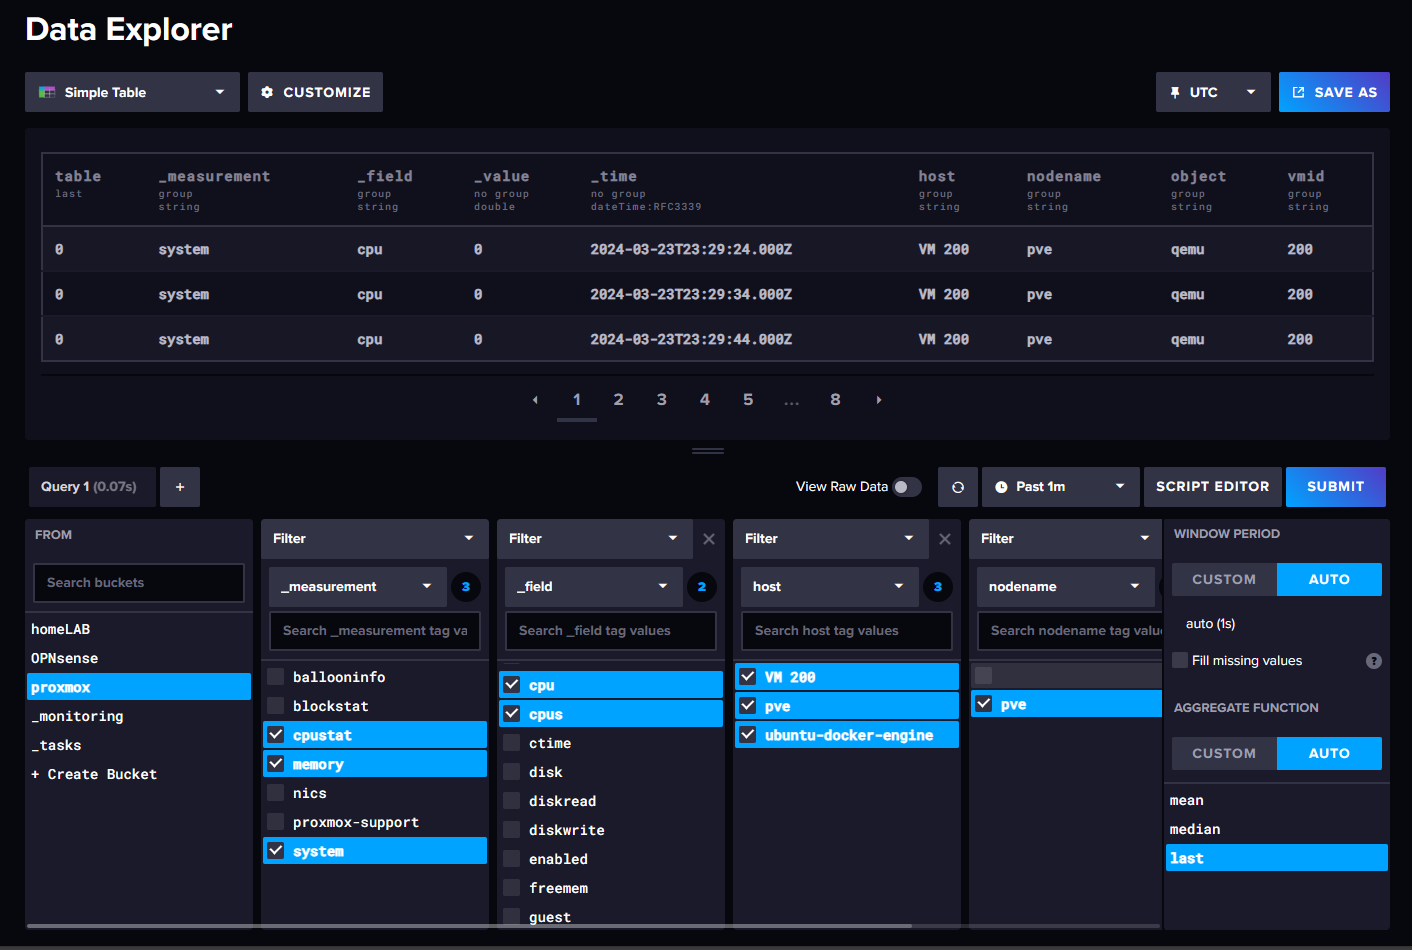
- Click ok, and navigate back to your InfluxDB GUI. To confirm it's worked, navigate to the Data Explorer tab. Select your bucket, and you should start to see categories of Proxmox data:

- Your InfluxDB is now actively collecting data!
Grafana Container - Docker
Set Up & Data Collection
Deploy your container, the log into the Web GUI. The navigate to Home ---> Connections ---> InfluxDB:
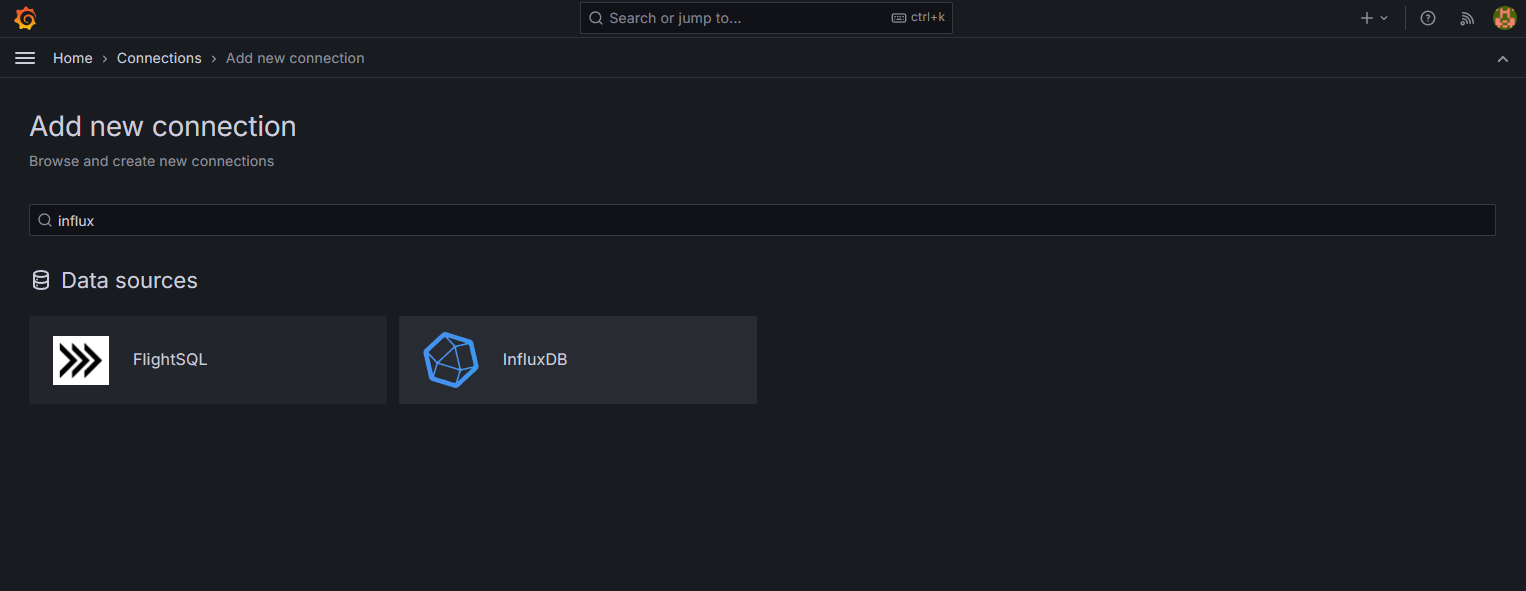
Select "Add new Data Source" then follow the below steps to establish connection to your InfluxDB:
- Change Query Language from Influxdb to Flux
- Enter http://localhost:8086 as the URL
- Make sure your containers are running on the same network. You can verify this via the Portainer Web GUI
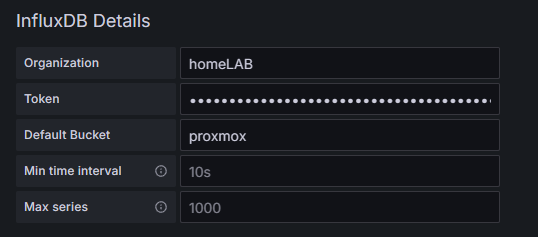
- Enter your Influxdb details, and then save&test
If your connection is successful, you'll see the following message display:

The Dashboard
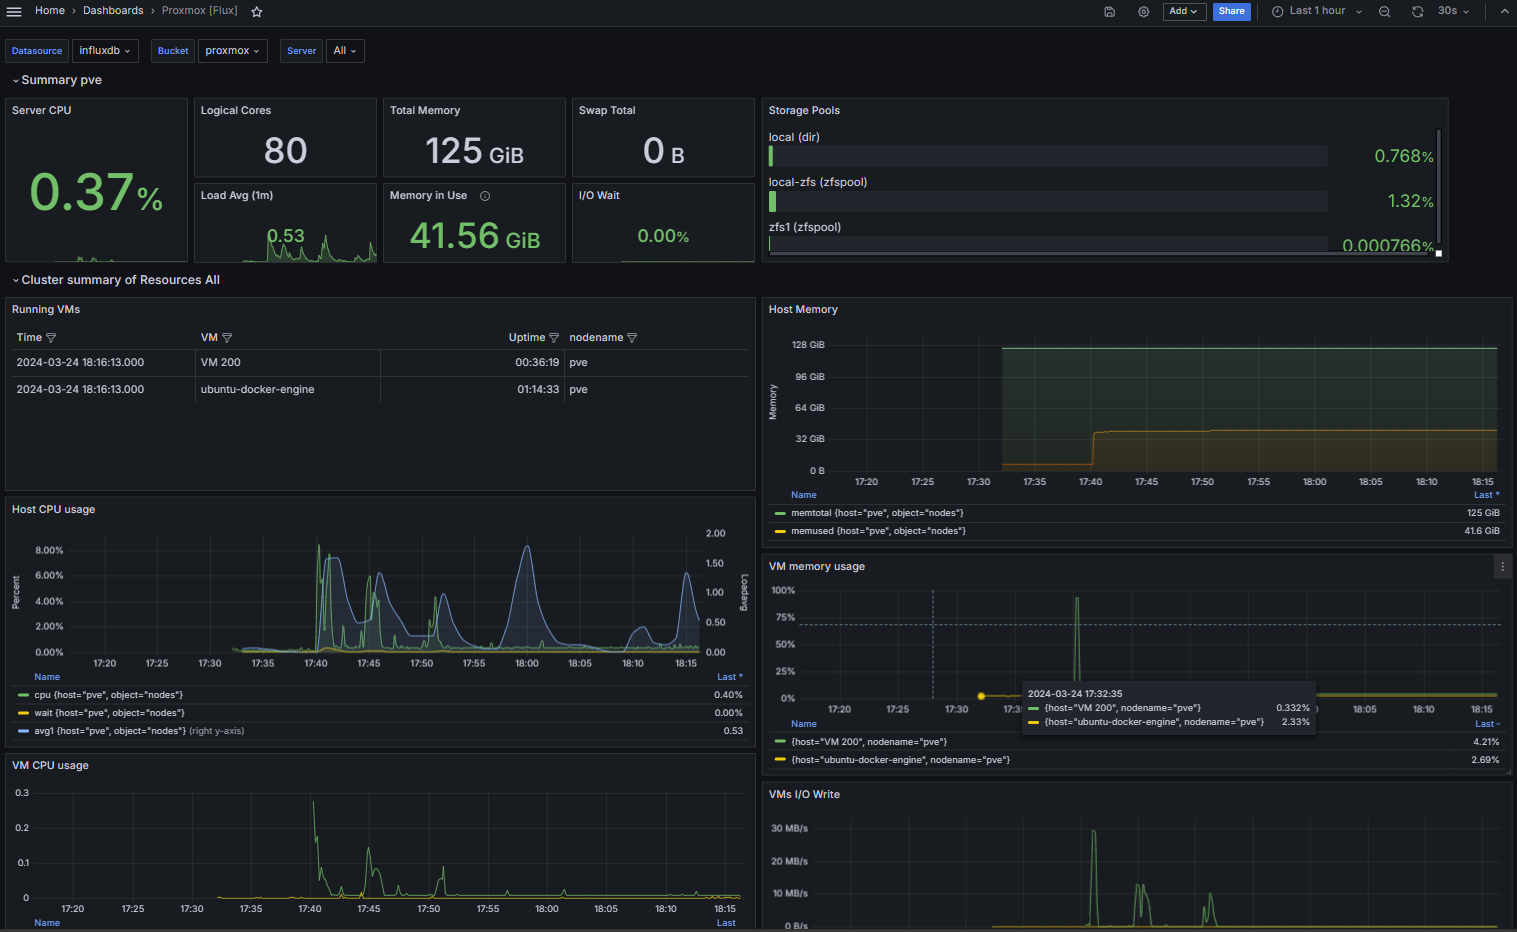
With your connections set up, you can build your dashboard. There are many templates on Grafana to choose from, or you can create your own. I chose to use the Proxmox Cluster [Flux] dashboard. See below:
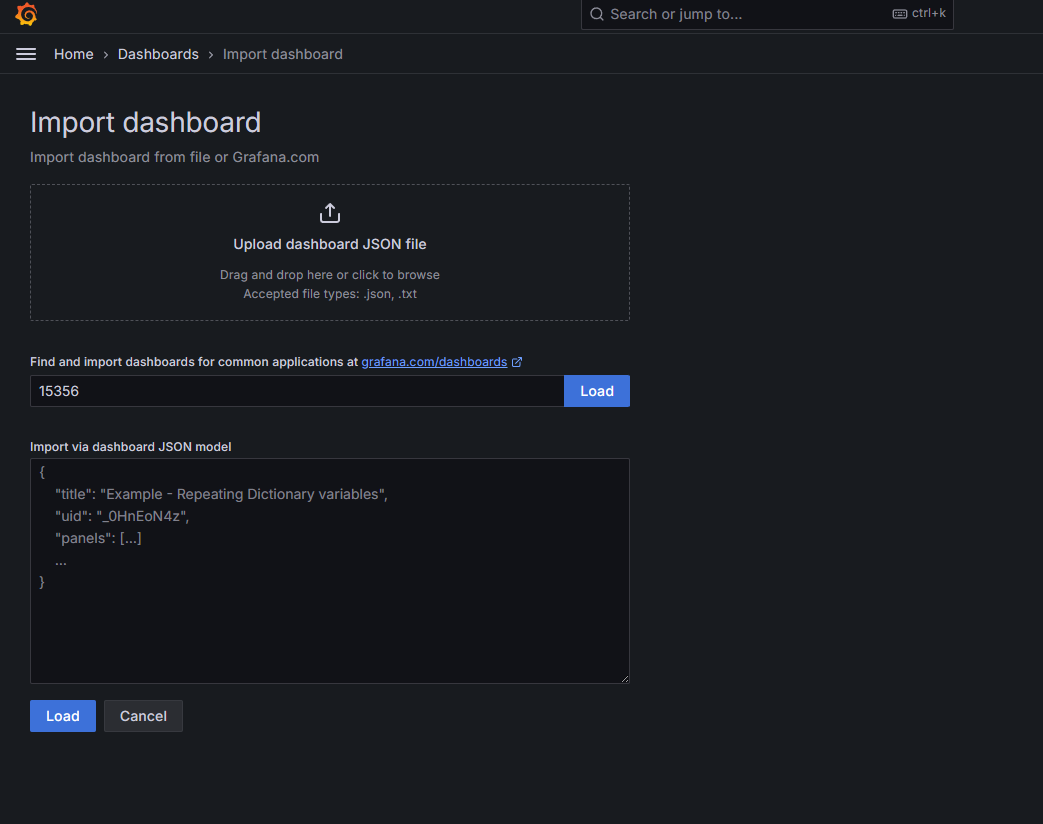
Here, import the Grafana template ID, then select load, and adjust name your Dashboard, then click Import:
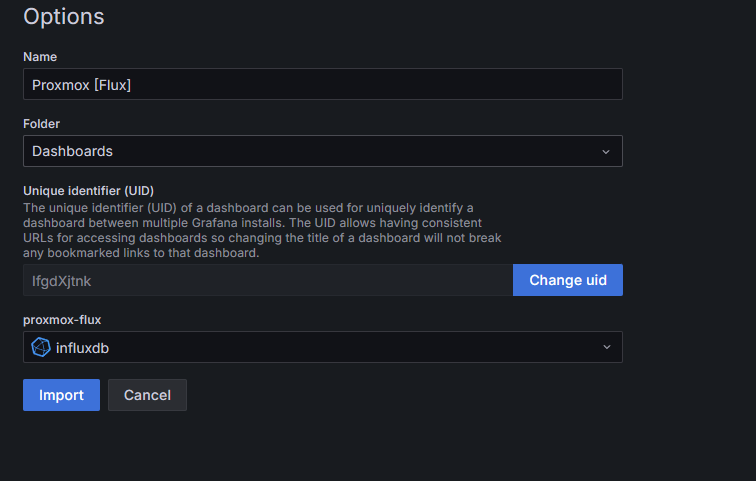
Once loaded, you'll need to select your InfluxDB bucket:
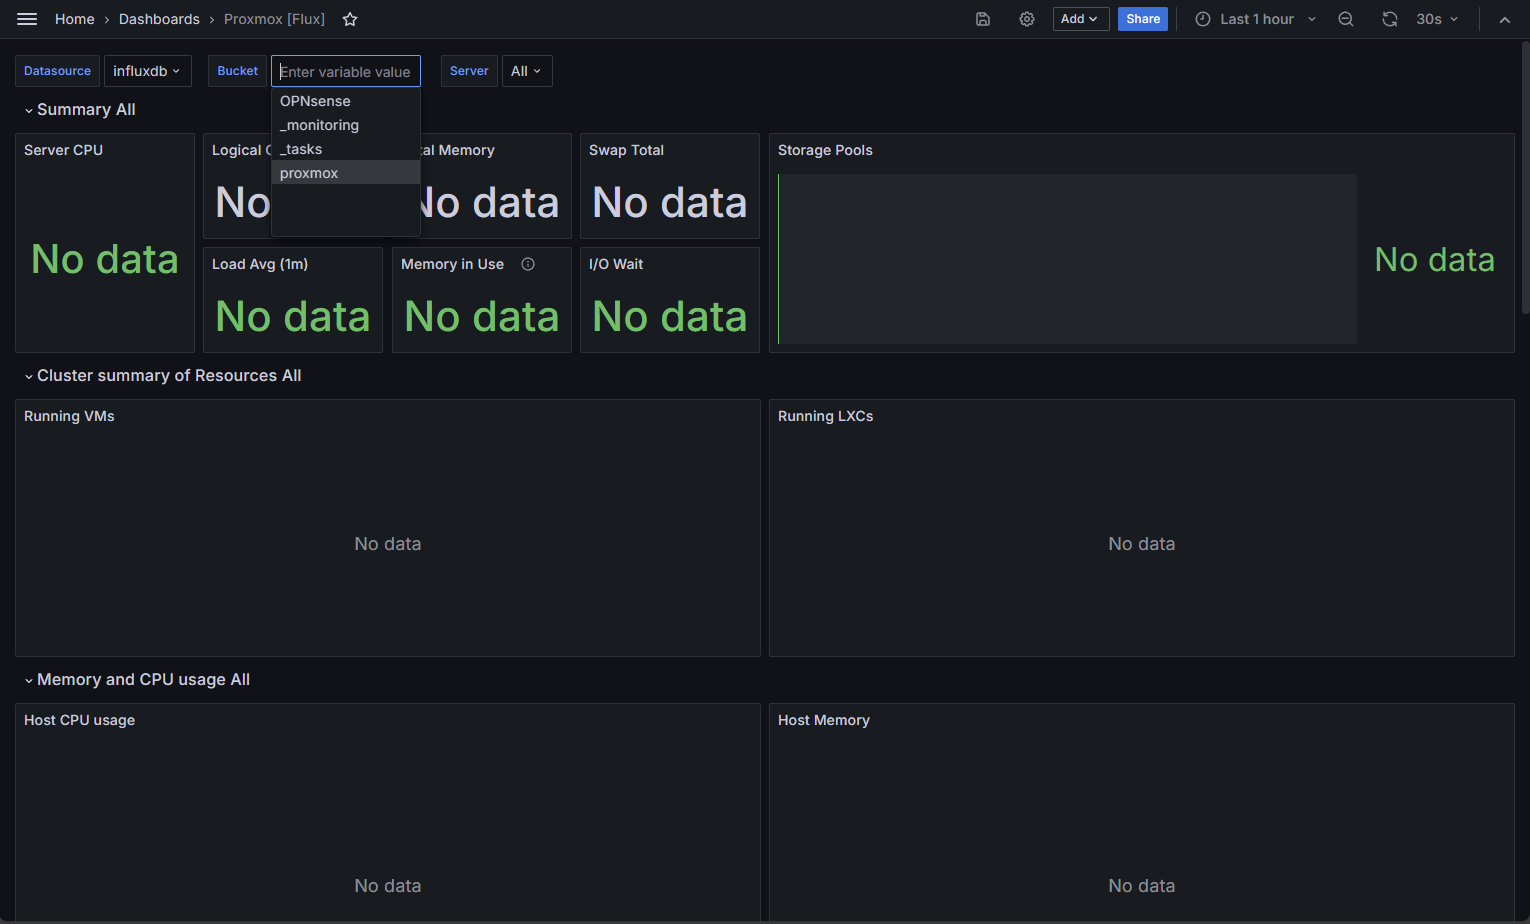
Your dashboard is all set!