The Dashboard
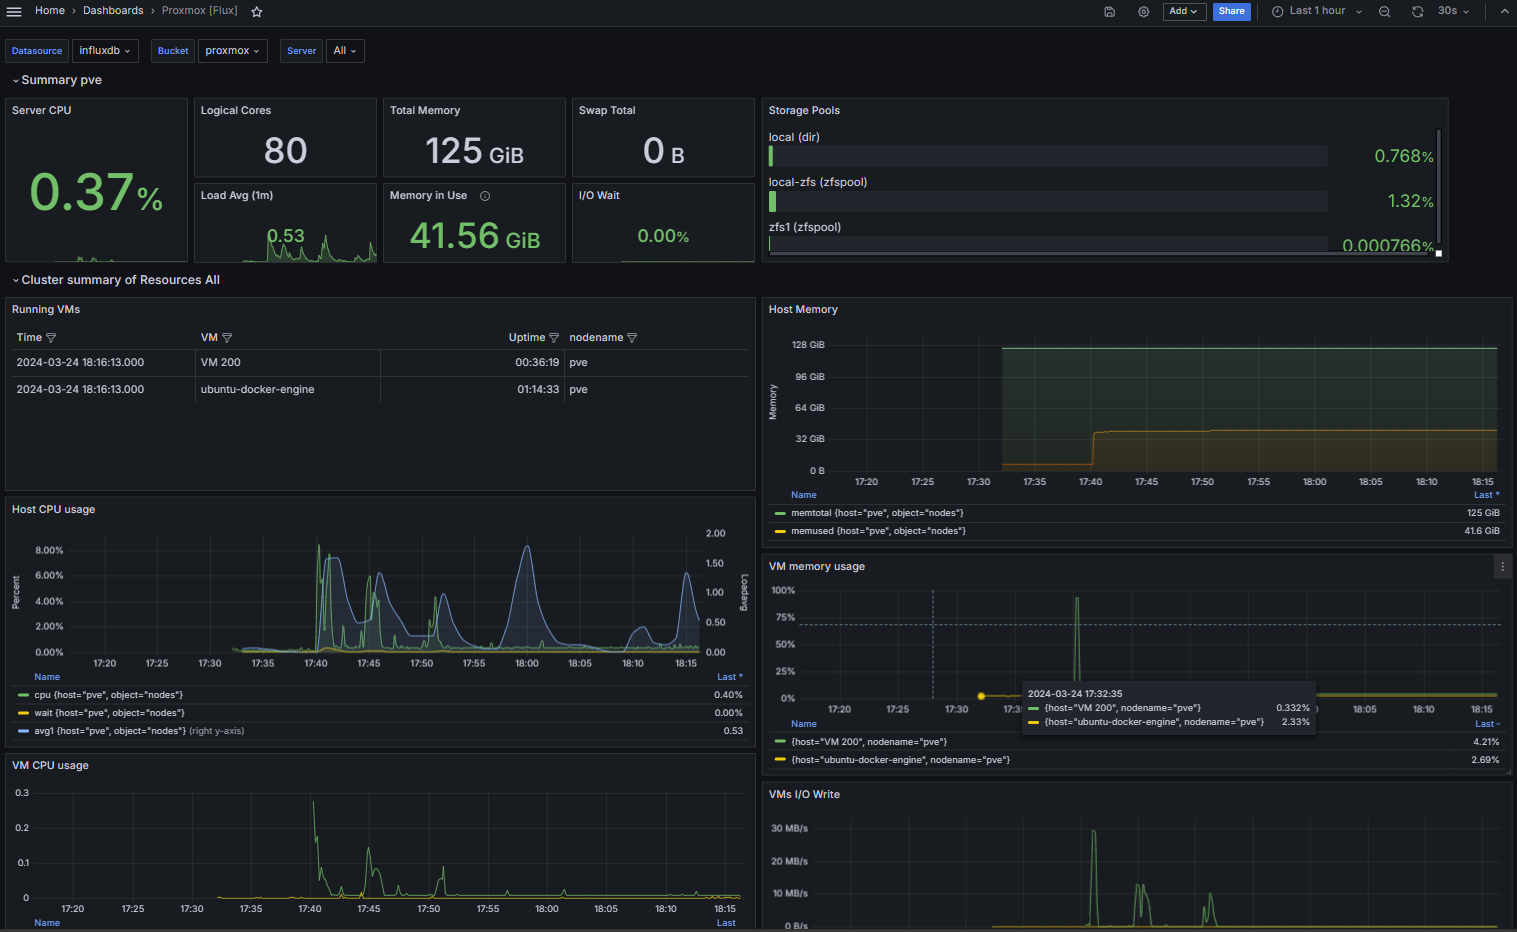
With your connections set up, you can build your dashboard. There are many templates on Grafana to choose from, or you can create your own. I chose to use the Proxmox Cluster [Flux] dashboard. See below:
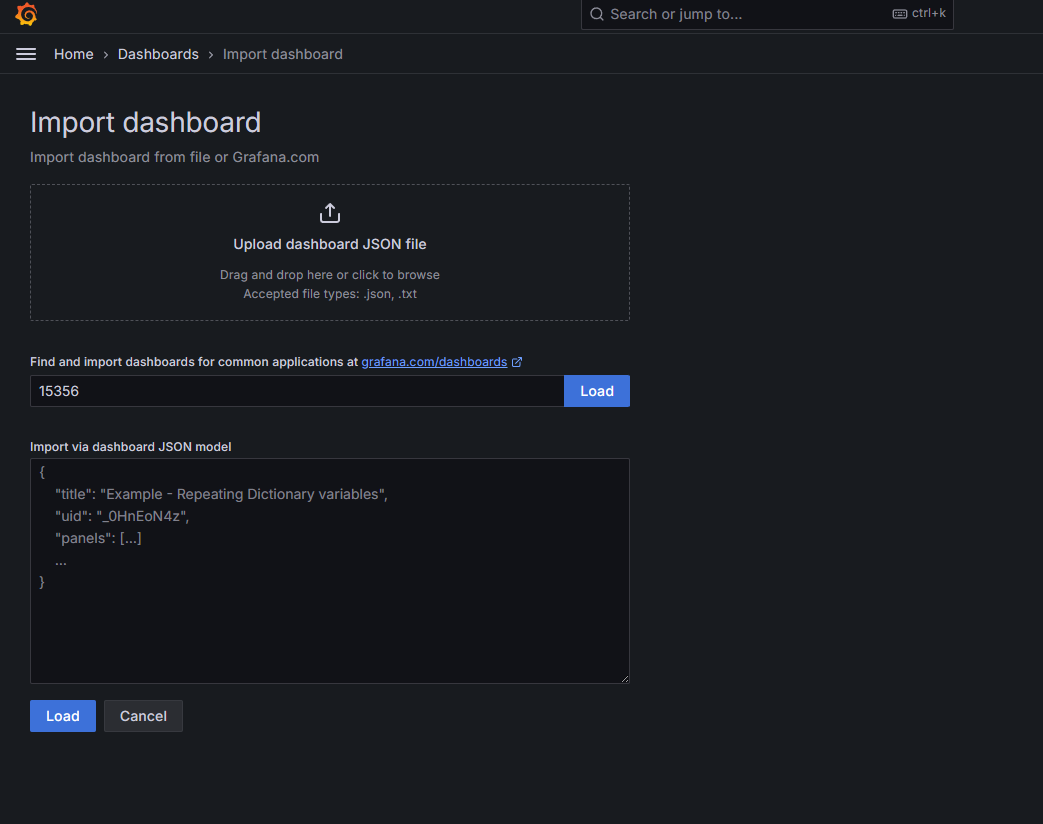
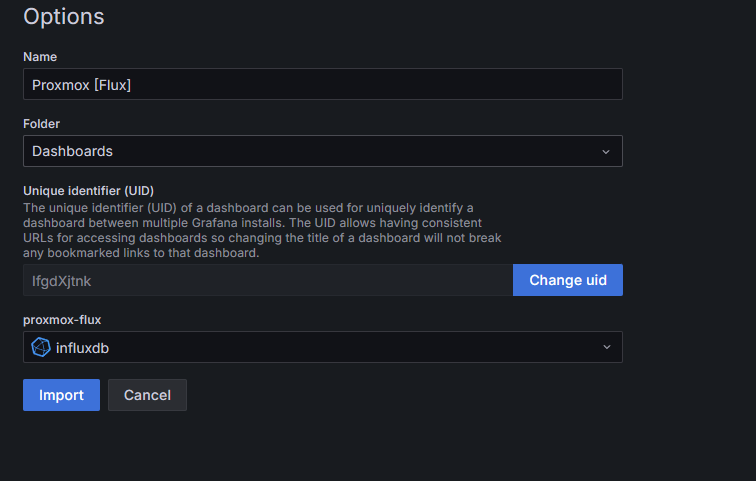
Here, import the Grafana template ID, then select load, and adjust name your Dashboard, then click Import:
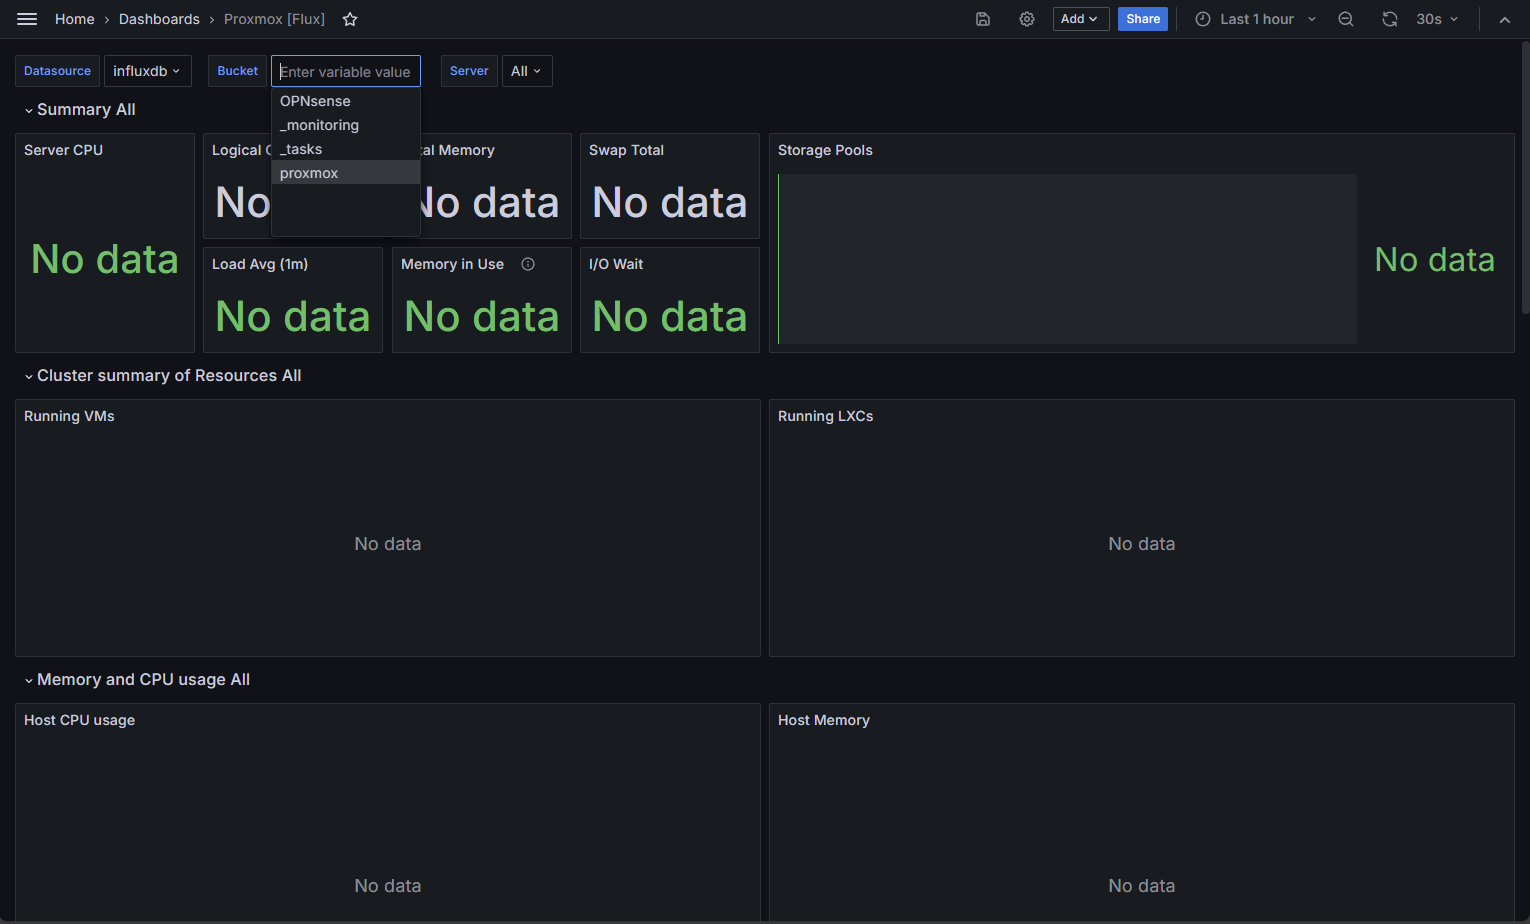
Once loaded, you'll need to select your InfluxDB bucket:
Your dashboard is all set!