Telegraf Agent --> InfluxDB
With my influxDB + Grafana connection already set up, I just need to create an OPNsense bucket in my InfluxDB container and connect it to a Telegraf agent to my OPNsense set-up.
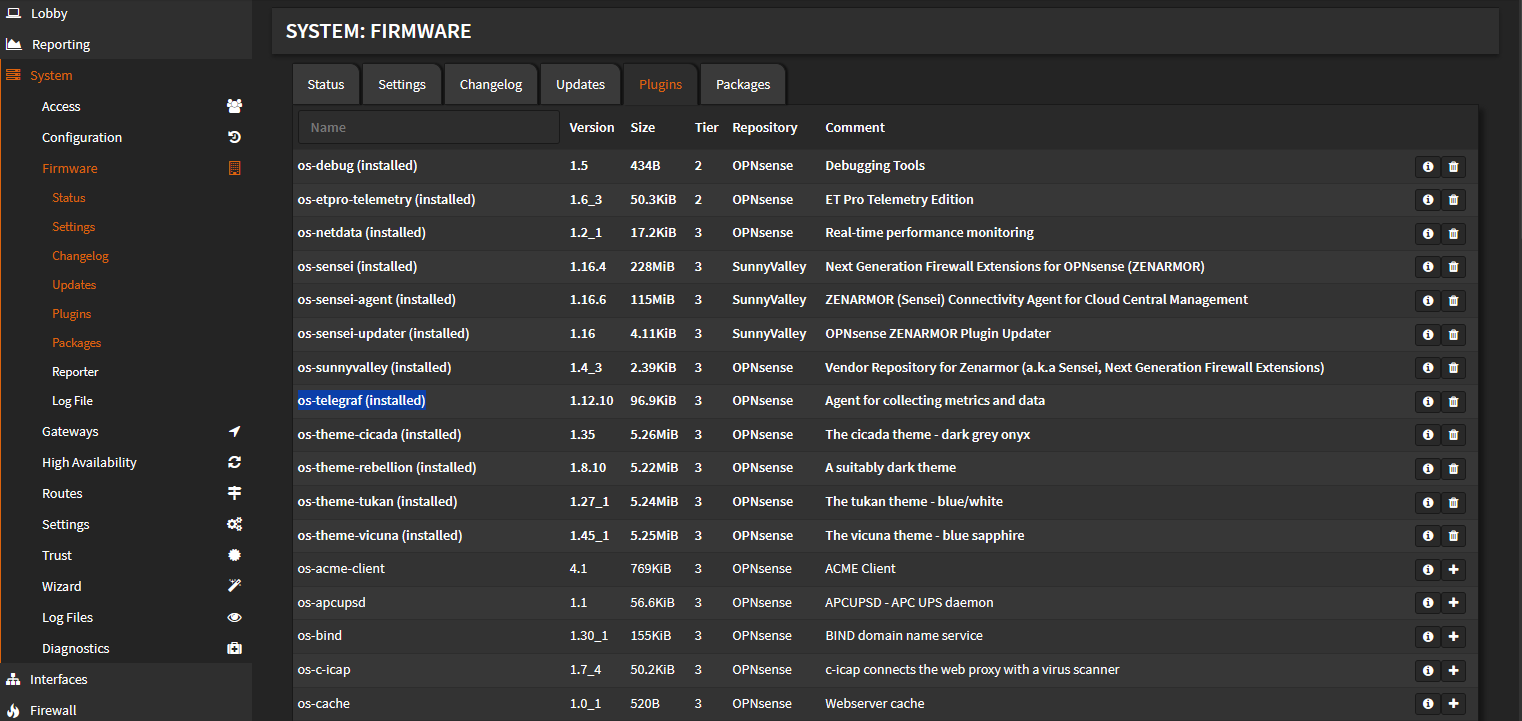
First, download the Telegraf plug in to your OPNsense machine. Navigate to System ---> Firmware ---> Plug-Ins and download Telegraf:
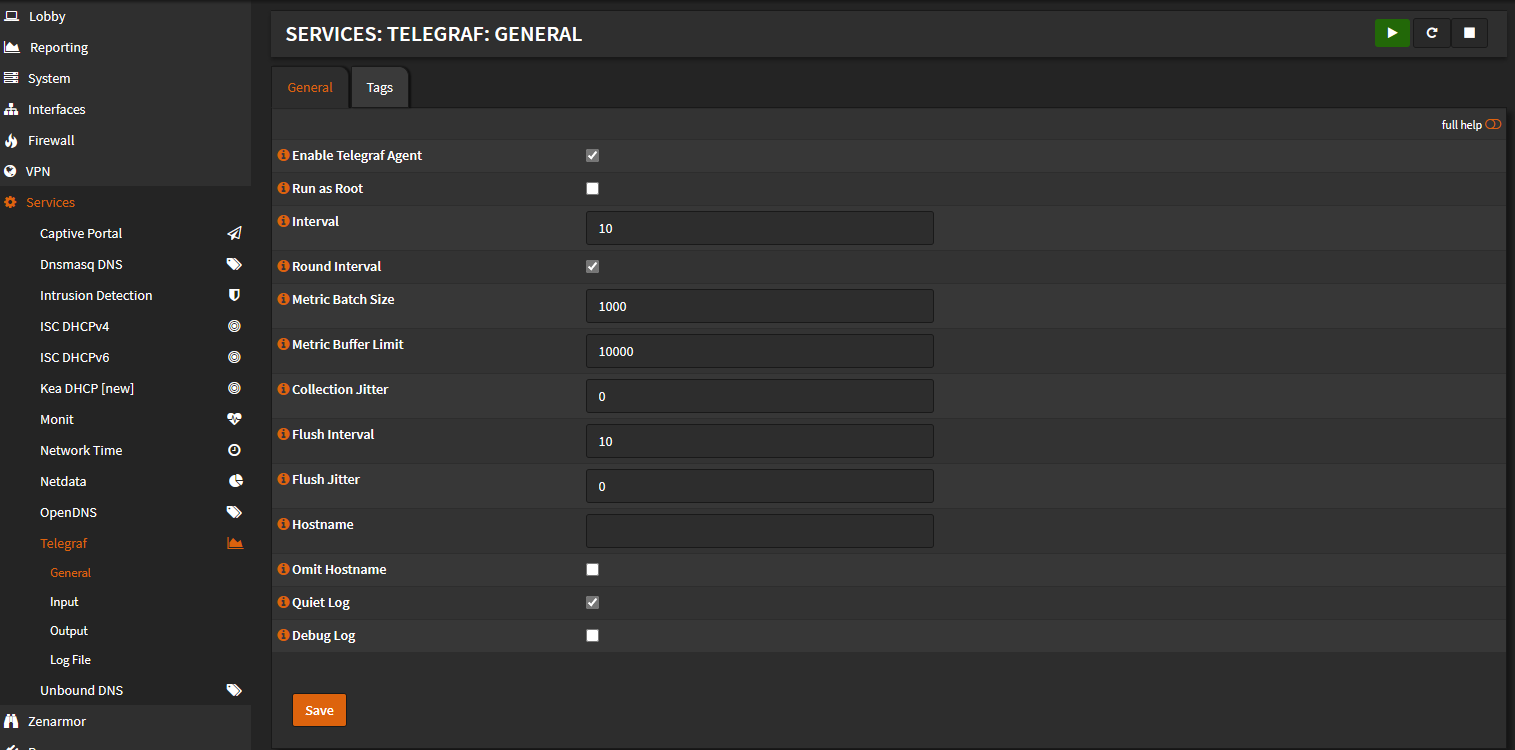
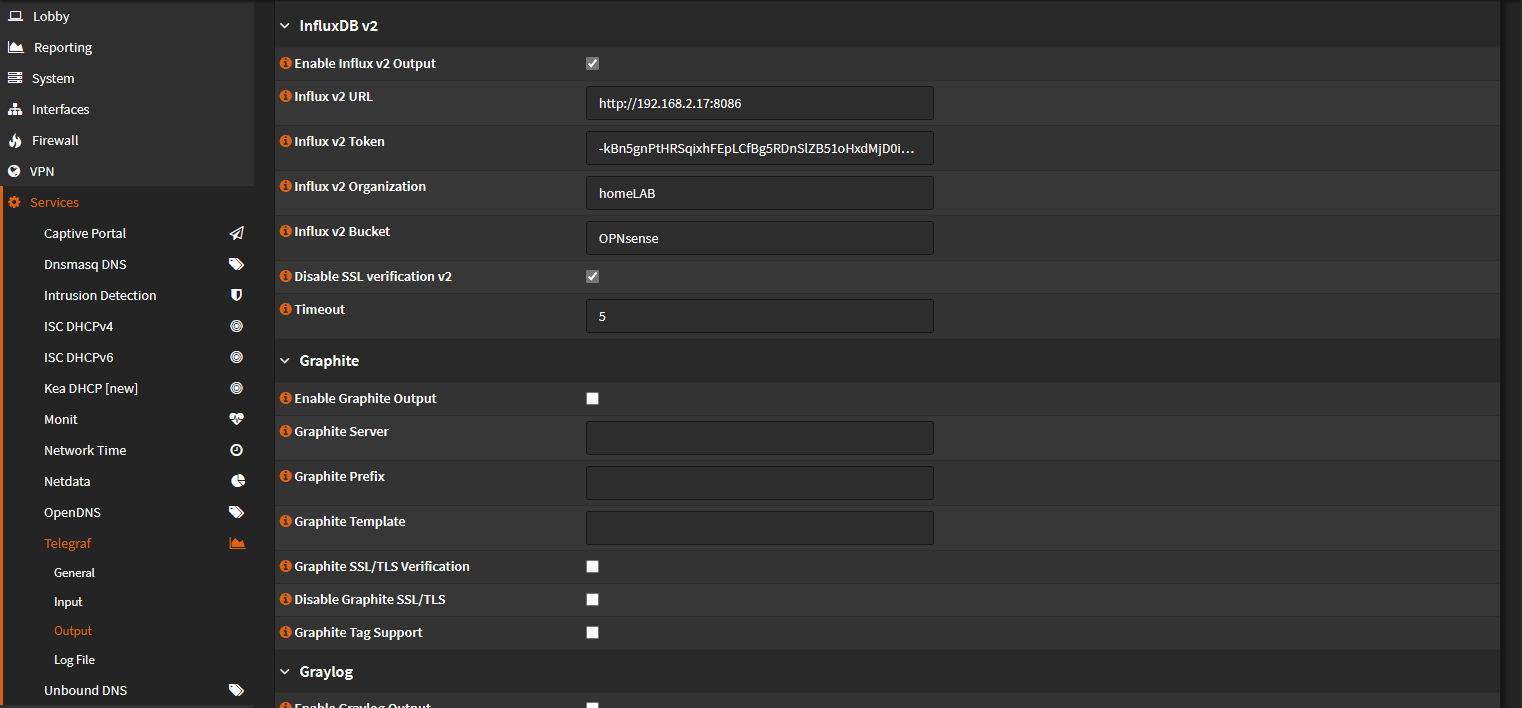
Save settings, then navigate to Telegraf ---> Output. Enable and enter connection information for your InfluxDB2 container:
Save settings, then navigate to your influxDB2 GUI and select your bucket to confirm you're receiving data:
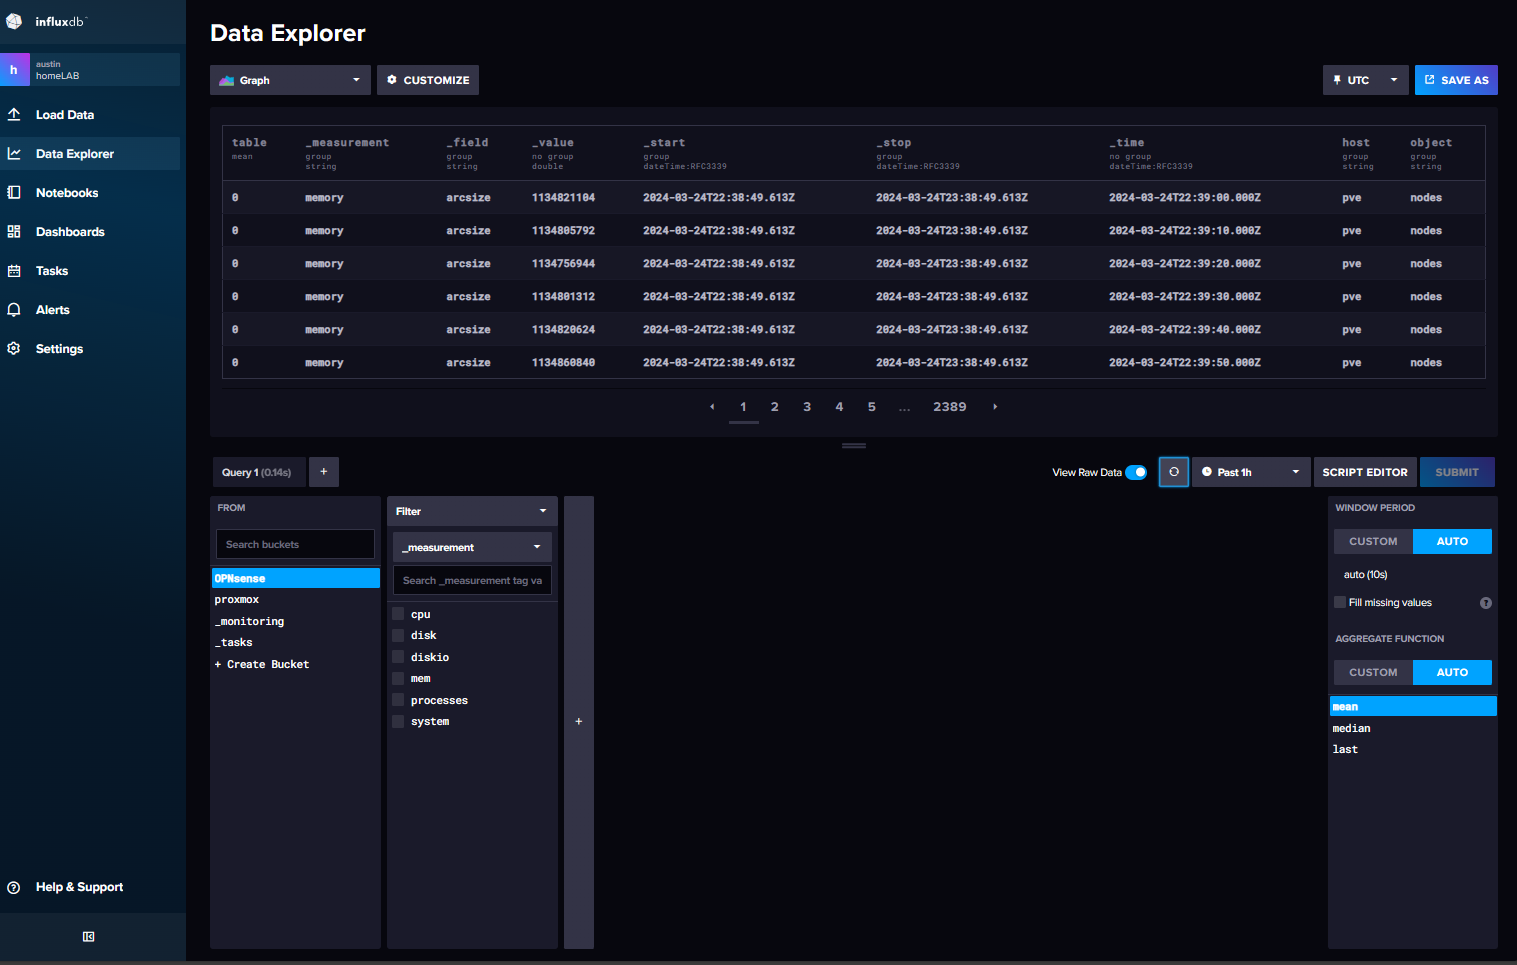
All set, you can now start building your dashboard with Grafana!