The Dashboard
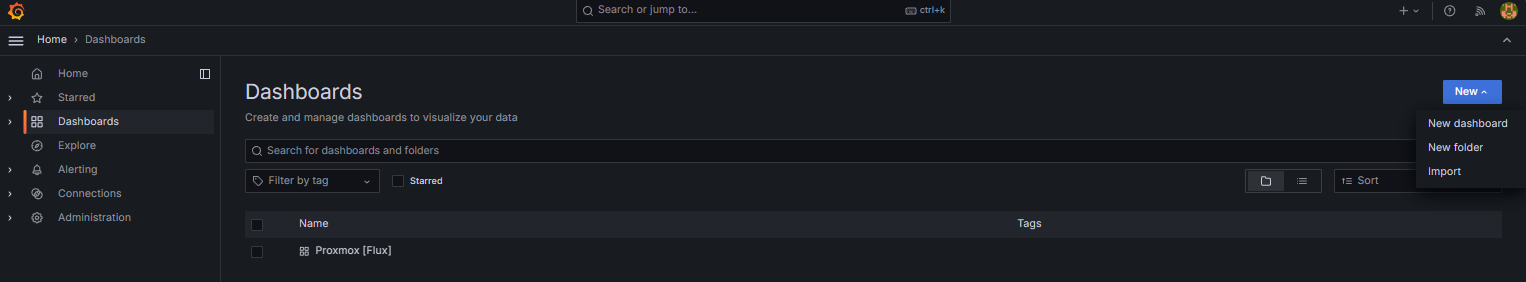
In Grafana, either load a template or build your own custom dashboard by navigating to Home ---> Dashboards ---> New:
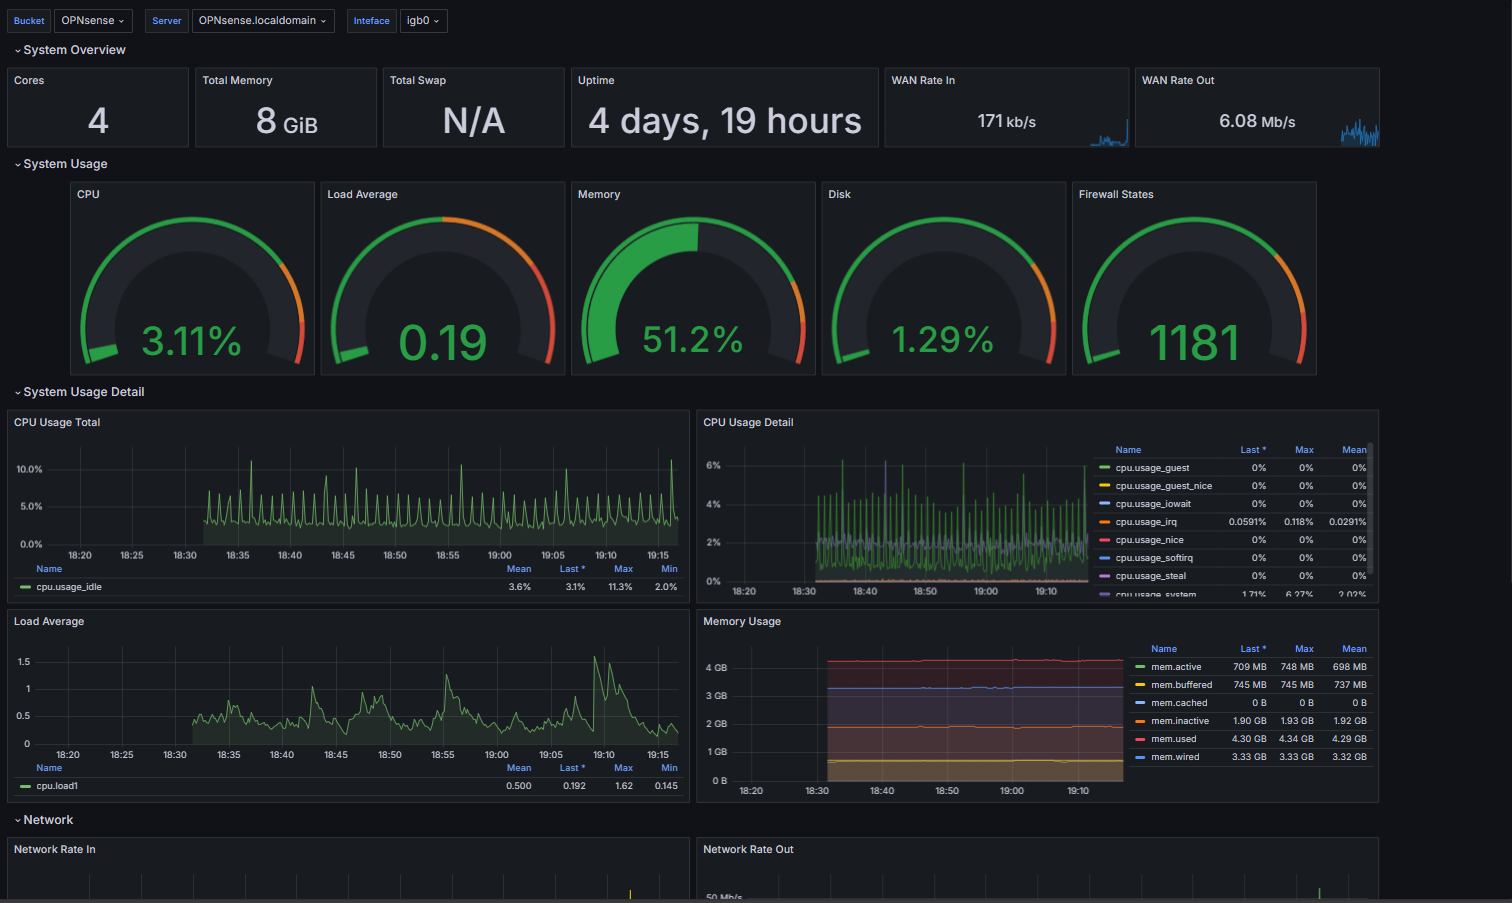
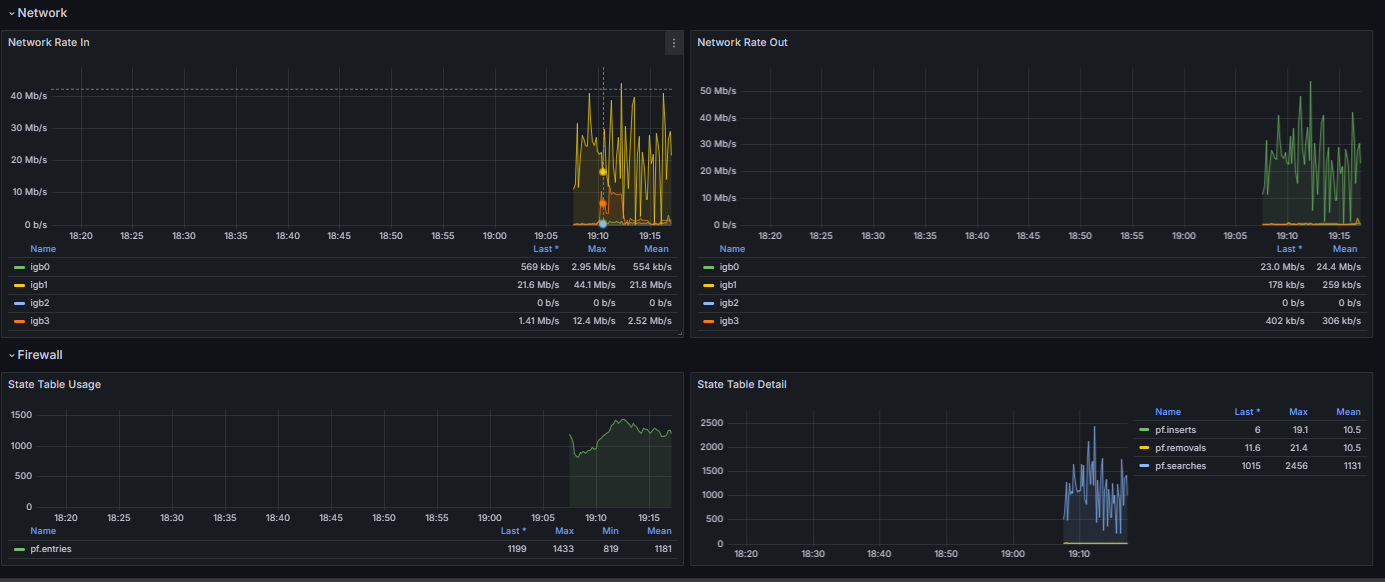
Given that OPNsense was forked from PFsense, you can either find PFsense dashboards and configure variables accordingly, use OPNsense templates, or just build your own dashboard. I used OPNsense Metrics. Load the dashboard and configure however you'd like!