Set Up & Data Collection
DownloadDeploy andyour runcontainer, the Grafanalog container.into the Web GUI. The navigate to Home ---> Connections ---> InfluxDB:
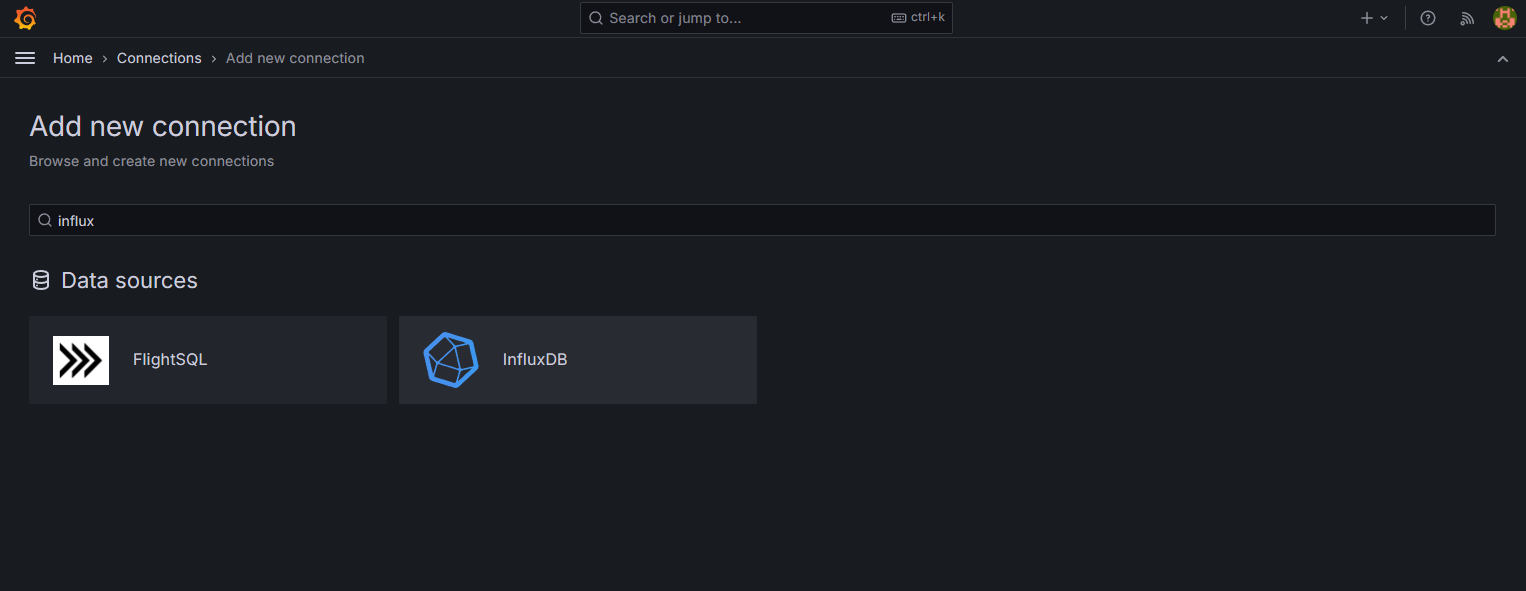
Select "Add new Data Source" then follow the below steps to establish connection to your InfluxDB:
Change Query Language from Influxdb to Flux
Enter http://localhost:8086 as the URL
Make sure your containers are running on the same network. You can
getverify morethis details about how to do so @DockerHub - Grafana. Or, you can just runvia the
followingPortainer command:Web
docker run -d --name=grafana -p 3000:3000 grafana/grafana
3000:3000 specifies it'll be accesible from port 3000 of the docker engine, which in my case is 192.168.2.17.GUI
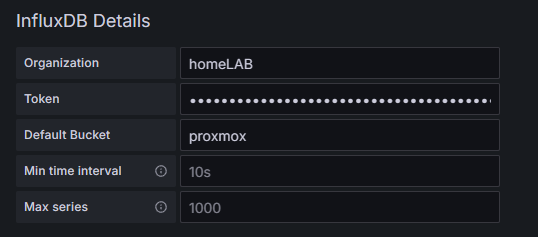
OnceEnter theyour containerInfluxdb isdetails, running,and gothen through the initial set up wizard via the Web GUI:

save&test

If your connection is successful, you'll see the following message display: